Table of Contents
Introduction
In this guide, we’ll provide you with an overview of operational dashboards explaining what they are, why they matter, and how they can benefit your business. By the end of this article, you’ll have a clear understanding of how operational dashboards can transform the way you monitor and manage your organization’s internal operations.
What are Operational Dashboards?
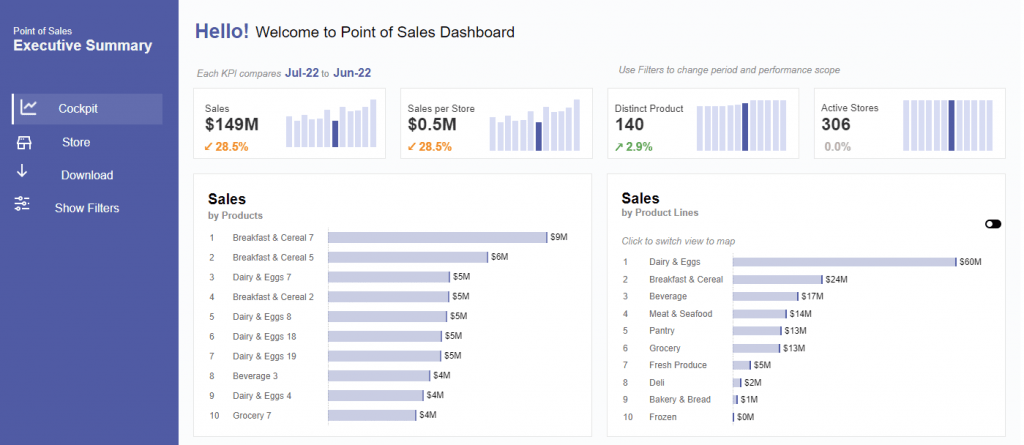
Operational Dashboards are a common business intelligence dashboard that display essential key performance indicators (also known as KPIs) in an easy-to-understand visual format. These dashboards are used by a wide-range of people including: CxOs, Executive Directors, Board Members, and various levels of decision-makers.
Operational Dashboards provide a (near) real-time, at-a-glance views of operational data to help organizations monitor and manage their day-to-day operations effectively. These dashboards are designed to provide actionable insights into various aspects of an organization’s activities, allowing decision-makers and operational teams to make informed decisions and respond quickly to changing circumstances.
These dashboards are considered as the “heartbeat” of your organization, offering a snapshot of key indicators like sales, inventory levels, website traffic, training sessions delivered, and more.

Why are Operational Dashboards useful?
Operational Dashboards are incredibly useful because they empower organizations to monitor their internal operations in (near) real-time, allow key decision-makers to make informed decisions, and respond quickly to challenges and opportunities that may arise.
They also provide quick-hitting answers to any operational questions that may be asked of CEOs or Executive Directors. Here are a few examples that Operational Dashboards can provide quick insights:
- An Executive Director of an education and training focused organization may be asked by the Board of Directors how many training sessions they have provided to the community in the past 12 months.
- A Regional Sales Director of a team of sales reps may be asked by the CEO what the team’s Close Rate is for this month compared to year-over-year (YoY).
- A Community Manager of a national organization may be asked by the Brand Director what the eNPS score is on their surveys over the past six months.
As you can see, Operational Dashboards are useful tools when there’s an high-level understanding of what questions need answers. Here are some more detailed reasons as to why Operational Dashboards are useful:
Real-Time Insights
This immediate access to data is critical for organizations that need to make rapid decisions and respond swiftly to changing circumstances.
Example – an e-commerce company can use a real-time operational dashboard to monitor website traffic during a flash sale and adjust their marketing strategies based on the current visitor data.
Actionable Information
These dashboards present data in a visual and easily digestible format, such as charts, graphs, and gauges. This visual representation enables users to quickly identify trends, patterns, and outliers, making it easier to take action. When teams can see performance metrics at a glance, they can make more informed decisions and address issues promptly.
Proactive Monitoring
Proactive Monitoring: Operational dashboards often include alerting and notification features. Users can set predefined thresholds or conditions, and when these conditions are met or exceeded, the dashboard can automatically trigger alerts. This proactive approach helps organizations identify and address problems before they escalate.
Example – an IT department can use an operational dashboard to receive alerts when server performance falls below acceptable levels, allowing them to resolve issues before they affect end-users.
Efficient Resource Allocation
By continuously monitoring KPIs and operational metrics, organizations can optimize resource allocation.
Example – a manufacturing company can use an operational dashboard to track production output, ensuring that resources are allocated effectively to meet production targets without overcommitting or underutilizing resources.
Improved Collaboration
Improved Collaboration: Operational dashboards are often accessible to multiple team members and departments. This accessibility fosters collaboration and alignment within an organization.
Example – a sales team can use a shared dashboard to track progress toward sales quotas, enabling them to coordinate efforts to achieve their goals.
Goal Tracking and Accountability
Operational dashboards make it easy to track progress toward specific goals and objectives. This transparency holds teams and individuals accountable for their performance. When employees can see their contributions in real-time, they are more motivated to meet or exceed targets.
Data-Driven Decision-Making
Operational dashboards promote a data-driven culture within an organization. Decision-makers can rely on accurate and up-to-date data to make informed choices rather than relying on intuition or outdated information. This leads to more effective decision-making and better overall business outcomes.
Customization
Operational dashboards can be tailored to meet the unique needs of different departments and roles within an organization. This customization ensures that each team has access to the most relevant data for their specific responsibilities.
Historical Data Analysis
While the primary focus of operational dashboards is real-time data, they often include historical data as well. This historical perspective allows organizations to analyze trends and performance over time, helping them make long-term strategic decisions and improvements.
What types of Operational Dashboards are there?
There are varying types of Operational Dashboards, each designed to serve a specific purpose and address different needs within the organization. Choosing the right type of dashboard is all about the problem you’re trying to solve. Let’s dive deeper into each type
Strategic Dashboards
- Purpose: Focused on high-level goals and objectives, these dashboards provide an overview of an organization’s performance.
- Why They Exist: Strategic dashboards help senior executives and leadership teams monitor progress toward long-term strategic initiatives. They focus on KPIs and metrics that are critical to the organization’s overall success. These dashboards enable leaders to assess whether the company is moving in the right direction and whether adjustments to the strategic plan are needed.
Tactical Dashboards
- Purpose: To delve deeper into specific operational areas or departments, such as sales, marketing, HR, or production.
- Why They Exist: Tactical dashboards are used by middle management and department heads to gain insights into the day-to-day operations of their respective areas. They provide detailed performance metrics and KPIs relevant to their specific responsibilities. By offering a more granular view, these dashboards help teams identify areas for improvement and make data-driven decisions to optimize operations.
Operational Dashboards
- Purpose: To track real-time data and metrics related to day-to-day operations, ensuring smooth and efficient processes.
- Why They Exist: Operational dashboards are the workhorses of an organization, designed to keep operations running smoothly. They provide immediate visibility into critical processes, enabling teams to monitor productivity, detect issues, and respond promptly. For instance, a logistics company might use an operational dashboard to track the location and status of shipments in real-time, ensuring timely deliveries and resolving any issues that arise during transit.
Analytical Dashboards
- Purpose: To support in-depth data analysis and exploration, enabling users to uncover trends, patterns, and insights within their data.
- Why They Exist: Analytical dashboards are used by data analysts, data scientists, and business intelligence professionals to dig deeper into data. They offer advanced analytics capabilities, including data filtering, drill-down functionality, and predictive analytics tools. These dashboards empower users to ask complex questions of their data and extract valuable insights, making them crucial for informed decision-making and strategic planning.
Compliance Dashboards
- Purpose: To ensure that operations adhere to regulatory, legal, and compliance standards.
- Why They Exist: Compliance dashboards are essential for industries and organizations subject to strict regulatory requirements, such as healthcare, finance, and pharmaceuticals. They help organizations monitor and demonstrate compliance with regulations, track key compliance metrics, and generate reports for audits and regulatory submissions.
Custom Dashboards
- Purpose: To cater to unique business needs and roles within an organization.
- Why They Exist: Custom dashboards are versatile and adaptable, allowing organizations to create tailored views of data that suit their specific requirements. They exist because no two organizations are exactly alike, and custom dashboards enable businesses to incorporate the metrics and data sources most relevant to their operations and goals.
Increase Your Organization’s Operational Efficiency
Operational dashboards exist to cater to the diverse needs of different users and departments within an organization. By providing specialized views and insights, these dashboards empower teams at all levels to monitor, analyze, and optimize their operations effectively, ultimately contributing to the overall success of the organization.
Of course, we can help you review your key performance indicators and put together a customized dashboard that works for you and your organizational needs.

